
In this investigation, students will use tectonics data in a Web GIS to identify the eastern and western boundaries of the North American plate. They will:
a. Analyze earthquake epicenter and volcano data to determine the boundaries of the North American Plate.
b. Analyze the movement of the surrounding plates to determine plate boundary types (divergent, convergent, or transform).
- Prior to implementing this learning activity, make sure that students have some prerequisite knowledge about earthquake epicenters and foci, and understand that there are three different types of plate boundaries (divergent, convergent, or transform). These concepts are explored in more detail in this investigation.
- We recommend that you read the How do we recognize plate boundaries? Teacher Guide prior to implementing this investigation. The Teacher Guide contains additional content and pedagogical support materials that are not described on this Web page.
1. Begin the class by asking students to respond to the following in their journals: How do we recognize plate boundaries?
2. Inform students that they will learn to use a GIS to recognize tectonic plate boundaries using earthquake and volcano data.
3. Use an LCD projector to display the Web GIS to the front of the room. The Web GIS will open to a map focused on the United States with a blue box around the study area.
4. Distribute the How do we recognize plate boundaries? Student Guide and Investigation Sheet to each student. Instruct students to follow the directions outlined in their guides.
5. Instruct students to go to: https://eli.lehigh.edu/learners/tectonics and click on How do we recognize plate boundaries?
6. If needed, provide an orientation of the Web GIS layout and tool features to your students. We recommend that you show students how to zoom-in and zoom-out to a location using the GIS navigation bar in addition to the Map Navigation Tools, how to navigate around the map, identify the cursor's geographic location (latitude and longitude), display data with the Map Layers and Map Legend, and use the Draw Tools. Show students how to click on Hide Tools to remove the toolbars menu from the GIS. They can then click Show Tools to display the toolbars menu again.
7. Model how to use the Map Layers tab to activate the Earthquakes M > 4.0 (9/08-9/11) layer and how to use the Map Legend tab to interpret this data layer. The size of the symbols and the number of earthquakes that are displayed in the Web GIS are dependent upon the extent of the navigational zoom. Fewer events are shown with broader navigational extents so the map is not too cluttered with overlapping data points.
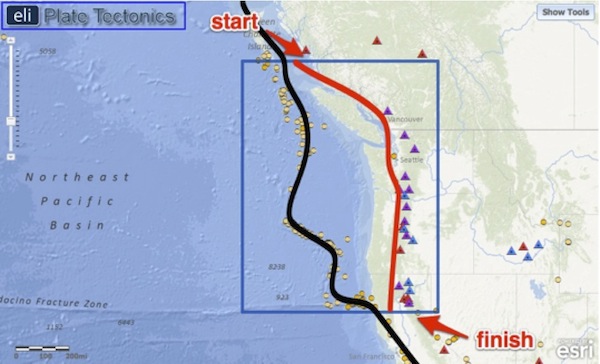
8. Model how to use the Draw Tools to draw a plate boundary on the map. Draw the students’ attention to the Aleutian Islands in Alaska (top left corner of the study area), where they will start drawing the eastern North American Plate boundary.
9. Have students begin the investigation, complete all data charts and answer the questions on their investigation sheets. Provide guidance to students as needed.
Important Note:
A misconception that many students have is that plate boundaries occur on volcanoes when in fact, plate boundaries occur near volcanoes. In Step 4, students are instructed to use the Polyline tool to create a plate boundary line to the west of the volcanoes near the coast of the Northeast Pacific Basin (See red line on image below). Make sure the student’s line does not trace the volcanoes or extend into the Pacific Ocean. The line should not be located on the coast, but should run parallel to it ~100 km to the east.
Implementation suggestion:
- For classes with students with special needs, you may wish to provide additional modeling, prompts and guidance as students work through the investigation. You may wish to explicitly model each procedural step with the Web GIS using a projected image before the students work independently or in pairs to complete the learning tasks.
10. Review and discuss aloud student responses to key questions on their Investigation Sheets. Ask students if they have any questions about concepts covered in the lesson and respond to their questions.
11. If students at the completion of the activity do not understand that the spatial distribution of earthquakes and volcanoes are related to plate boundaries, and that relative plate motions define the type of boundary, modify instruction as needed to ensure students understand these concepts.
12. To provide closure to this investigation, have students reflect on what they have learned about plate tectonic boundaries and discuss their responses. Here are some suggestions:
Provide students with a reflective question to respond in their journals about tectonics. For example:
a) What is the relationship between plate boundaries and the location of earthquakes and volcanoes?
b) Why do some plate boundaries have both earthquakes and volcanoes?
Materials Needed:
Handouts
(1) How do we recognize plate boundaries? Teacher Guide (PDF / MS Word)
(2) How do we recognize plate boundaries? Student Guide (PDF / MS Word)
(3) How do we recognize plate boundaries? Investigation Sheet (PDF / MS Word)
Web GIS
Assessment Information
Teacher Resources/Content Support