2007 US Energy Consumption by Sector
|
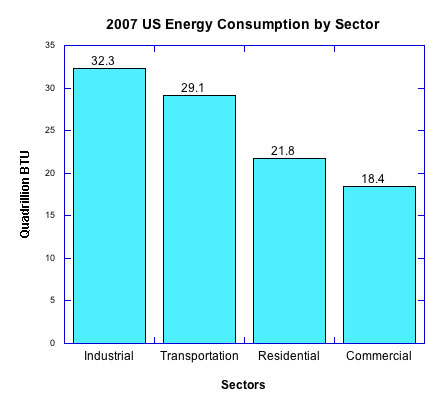
The bar graph on the left displays the amount of energy each sector used in quadrillion BTU. The industrial sector includes construction and factories and other businesses where things are made. The transportation sector includes aircraft, trains, light-duty vehicles, and trucks. The residential sector includes homes. The commercial sector includes hotels, restaurants, retail stores, laundromats, hospitals, gyms, malls, schools, colleges, and offices. |
|
|
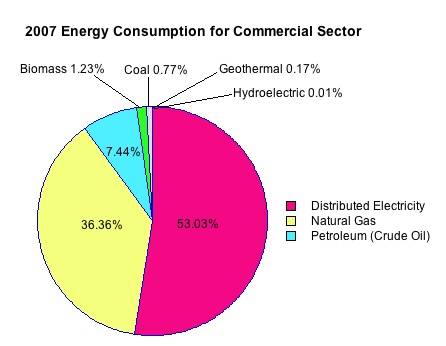
The pie chart on the left displays the percentage of each energy source that was used in the commercial sector. Coal was used for heating. Distributed electricity is electricity that is purchased from the grid. It is generated and distributed from various kinds of power plants. Sustainable (renewable) energy sources include biomass, geothermal, and hydroelectric. Non-renewable energy sources include natural gas, petroleum (crude oil), and coal. |
|
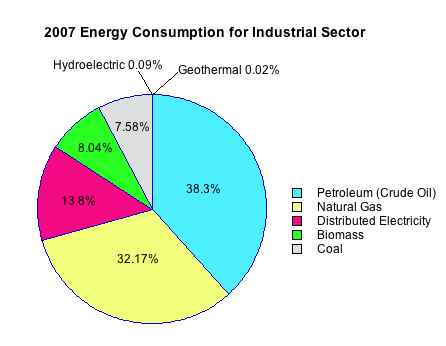 |
The pie chart on the left displays the percentage of each energy source that was used in the industrial sector. Coal was used for heating. Distributed electricity is electricity that is purchased from the grid. It is generated and distributed from various kinds of power plants. Sustainable (renewable) energy sources include biomass, hydroelectric, and geothermal. Non-renewable energy sources include petroleum (crude oil), natural gas, and coal. |

