Atlanta Case Study: Land Use Classification Maps

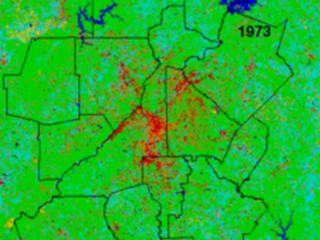
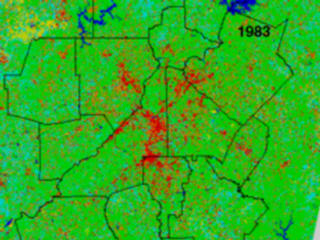
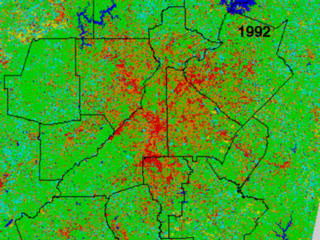
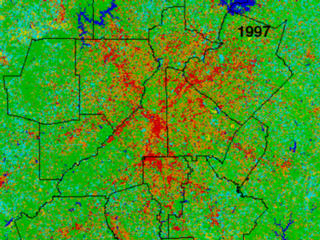
Classification maps of Atlanta land use for the years 1973, 1983, 1992, 1997
Red and orange points indicate areas of highest urban growth.

Atlanta Land Use 1973
Atlanta Land Use 1983
This image shows a classification map of Atlanta land use for 1973.  Low dense urban area. This image shows a classification map of Atlanta land use for 1983.  Low dense urban area.


This image displays a land use key for the images on this page.  Red is dense urban area, green is forested area, water is blue, and orange is sparse urban area.


Atlanta Land Use 1992
Atlanta Land Use 1997
This image shows a classification map of Atlanta land use for 1992.  High dense urban and suburban area. This image shows a classification map of Atlanta land use for 1992.  High dense urban and suburban area.